
Visual storytelling for consultants
Turn complex analysis into a visual story your client can follow. Drawify helps consultants combine artist-created illustrations, templates, text and simple composition tools to explain a current situation, a proposed change and the work required to move forward.
Use Drawify for strategy presentations, process maps, stakeholder conversations, workshop materials and other client communication where the structure matters as much as the detail.
What is visual storytelling in consulting?
Visual storytelling in consulting means arranging evidence, ideas and recommendations into a sequence that helps a client see how the parts relate.
It is more than adding an icon to a slide. A useful consulting visual establishes context, makes the central issue visible and shows what happens next.
It might connect a current state to a future state, trace a customer experience, show a process and its bottleneck, or distinguish stakeholders by their role in a decision.
The consultant remains responsible for the analysis, evidence and recommendation. Drawify provides visual building blocks and layouts for communicating that work.
How Drawify supports consultant communication
Start with a consulting question
Before choosing an image, define what the client needs to understand.
Is the conversation about a problem, a trade-off, an operating model, a sequence of actions or a future direction? That question determines the structure of the visual.
Use a template when the structure already exists
Use an appropriate Drawify template when it provides a useful starting structure, then replace generic content with the facts and language of the engagement.
Find artist-created illustrations
Search Drawify's hand-drawn illustration library for people, objects, actions and visual metaphors that match the message.
The purpose is not to decorate every section. Choose visuals that help the audience recognise a role, situation, obstacle or outcome.
Compose the story
Arrange illustrations, text and other elements on the Drawify canvas.
Use position, scale, sequence and connectors to show relationships rather than asking the client to mentally connect several unrelated pieces.
Customise the visual
Adjust the composition, supported colours, text and other available settings to fit the engagement.
Export for the client workflow
Drawify supports PNG, JPEG and PDF export. Use the exported visual in the presentation, report, workshop pack or other appropriate deliverable.
Drawify also has integrations for Miro and Google Slides. Follow each integration's documented workflow rather than assuming automatic project synchronisation.
A practical consultant workflow
1. Define the decision or conversation
Write one sentence that explains why the visual is needed.
For example: “The leadership team needs to agree on which operational bottleneck to address first.”
2. Identify the evidence
List the research, observations, data and client inputs that support the story.
Decide which evidence belongs in the visual and which belongs in notes, an appendix or the accompanying report.
3. Choose a story structure
Select a structure that matches the work.
- Current state → tension → future state.
- Problem → causes → response.
- Stakeholder → need → interaction.
- Step → handoff → bottleneck.
- Finding → implication → recommendation.
- Phase → milestone → owner.
4. Choose a Drawify starting point
Use a relevant template or start from a blank canvas. A template can supply the visual grammar; the engagement supplies the substance.
5. Build the first version
Add only the headings, evidence and visuals needed to communicate the core story.
Keep labels specific to the client context and avoid generic claims such as “better results” when the engagement has defined a more precise outcome.
6. Review for accuracy
Check every label, relationship and implied conclusion.
Confirm that the illustration does not oversimplify a material risk, combine stakeholders who should remain distinct or imply causation that the evidence does not support.
7. Use it in the client conversation
Export the visual or use a supported integration. Present the story in sequence, invite corrections and record decisions separately.
Practical visual storytelling use cases for consultants
Strategy: show the logic of a recommendation
Connect the client's present context, strategic tension and proposed direction in one view.
Drawify can help make the logic visible, but it does not validate the recommendation.
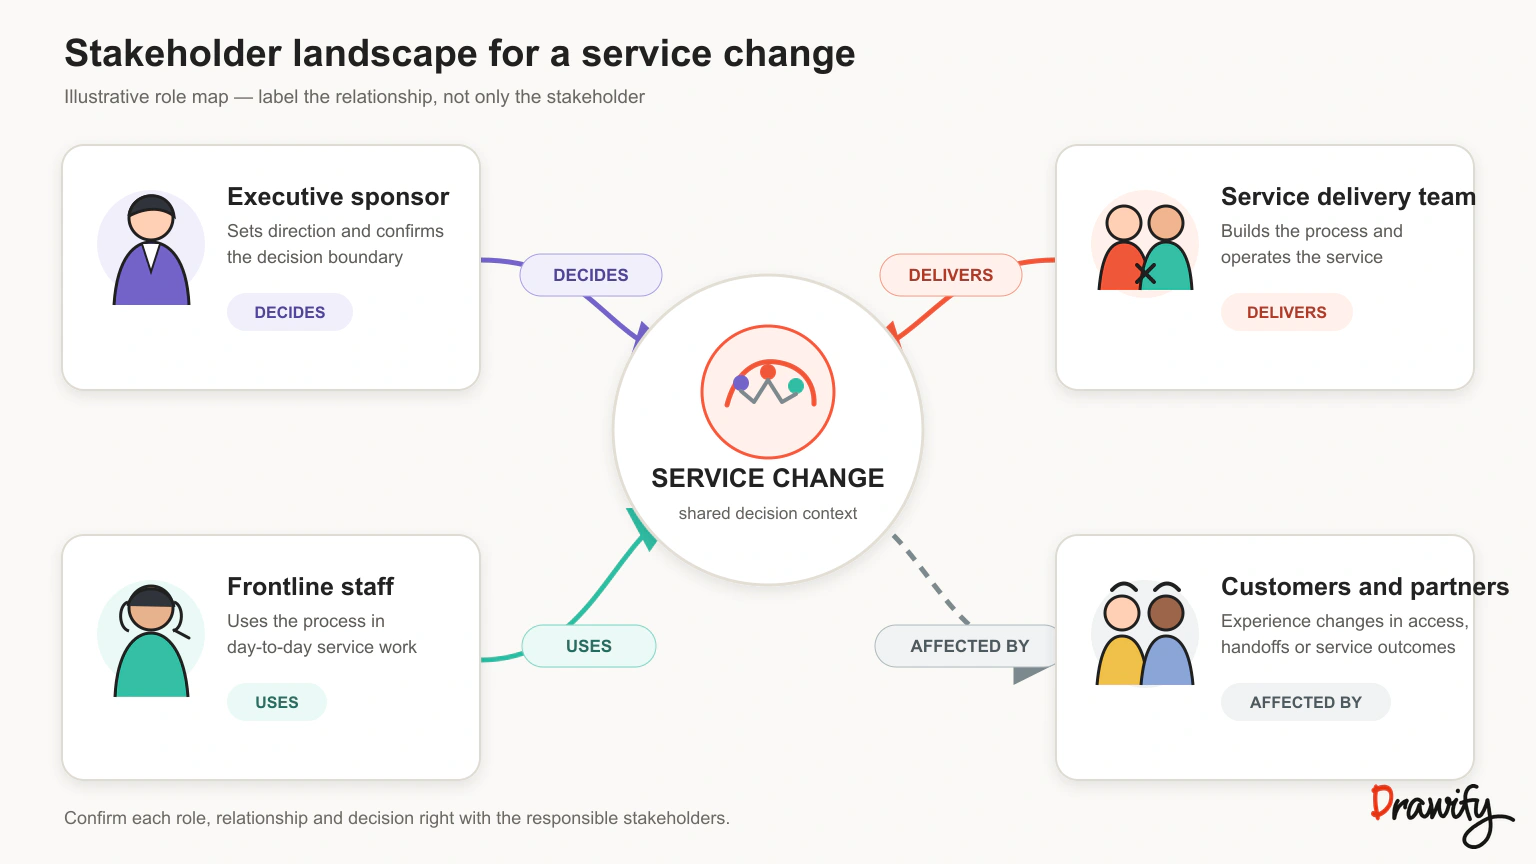
Stakeholder mapping: make roles and relationships visible
Use a stakeholder map to distinguish decision-makers, participants, users, partners and affected groups.
Label the relationship or responsibility rather than relying on illustration or proximity alone.
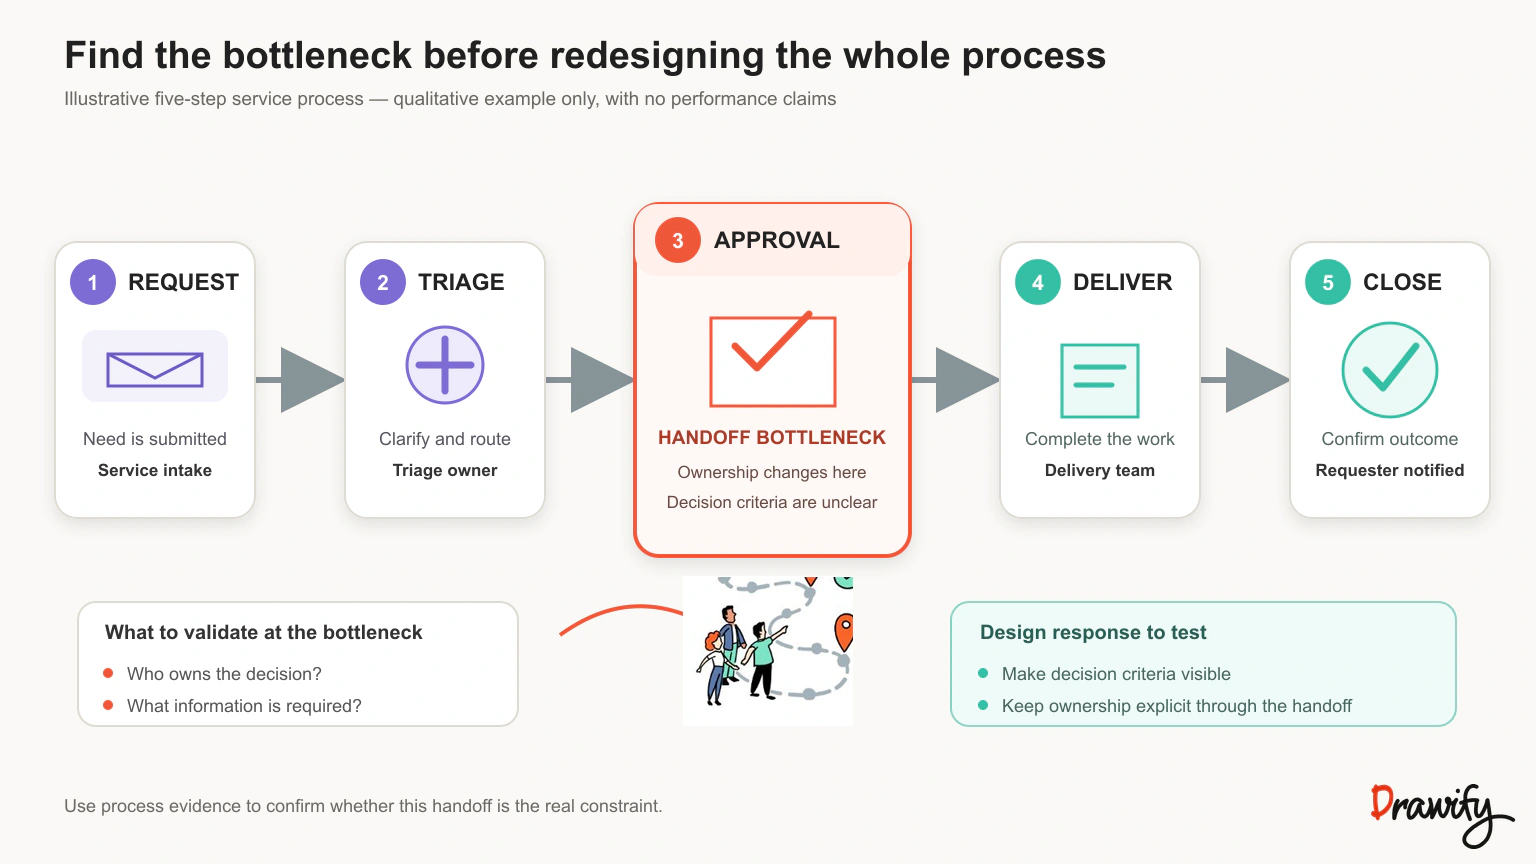
Process improvement: reveal steps and handoffs
Build a flow from trigger to outcome, then mark the point where delay, rework or uncertainty occurs.
Keep measurements and process evidence visible in the accompanying analysis. The illustration should clarify the flow, not replace process data.
Customer experience: tell the journey from the customer's point of view
Map the stages a customer moves through and use illustrated people, environments or objects to distinguish moments in the experience.
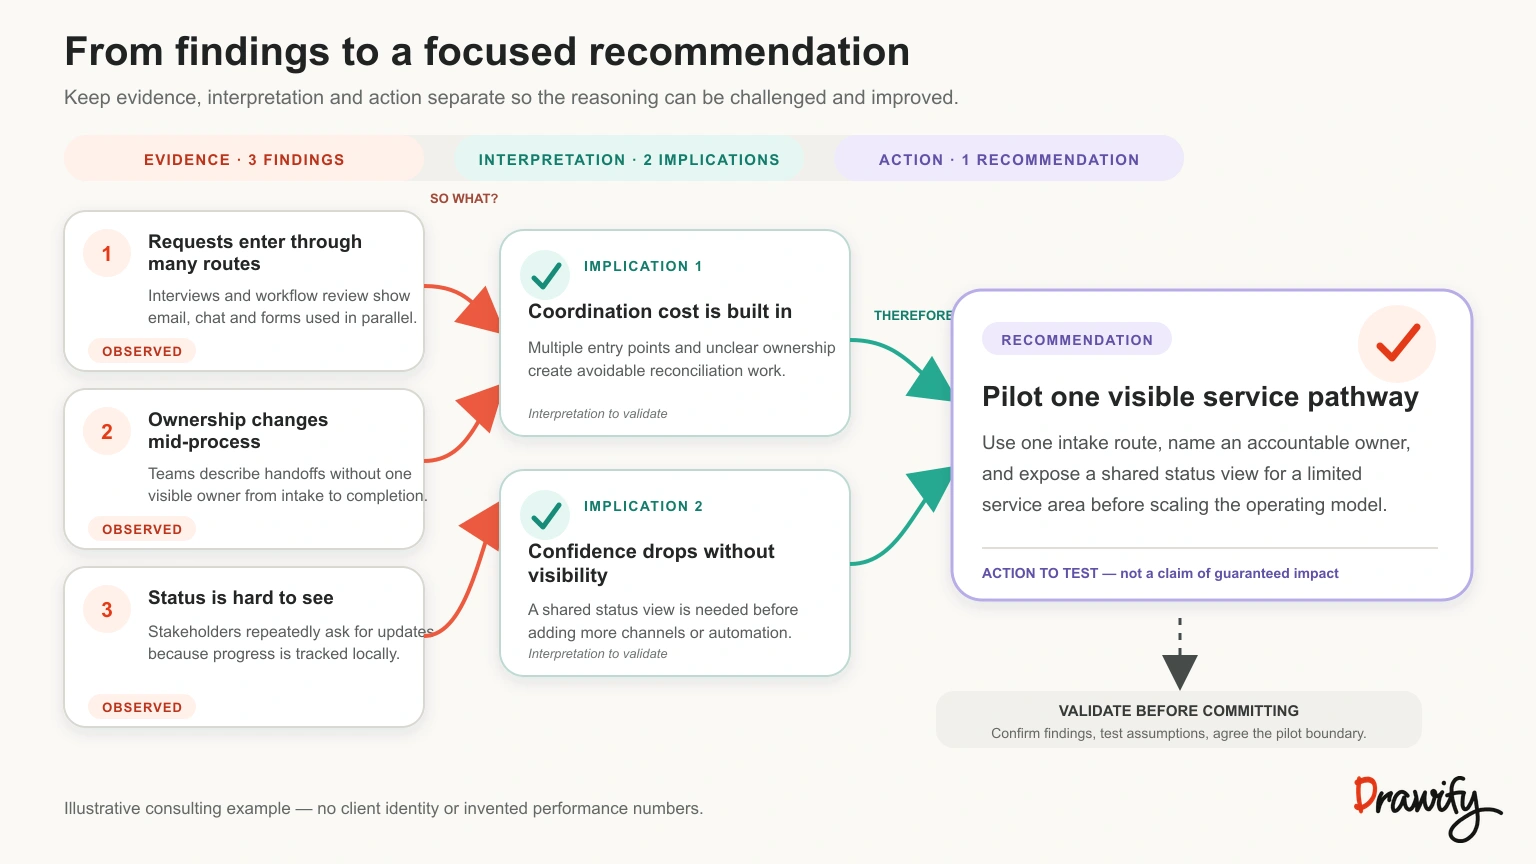
Research synthesis: connect findings to implications
Use a visual to group related observations and show how they lead to a small number of implications.
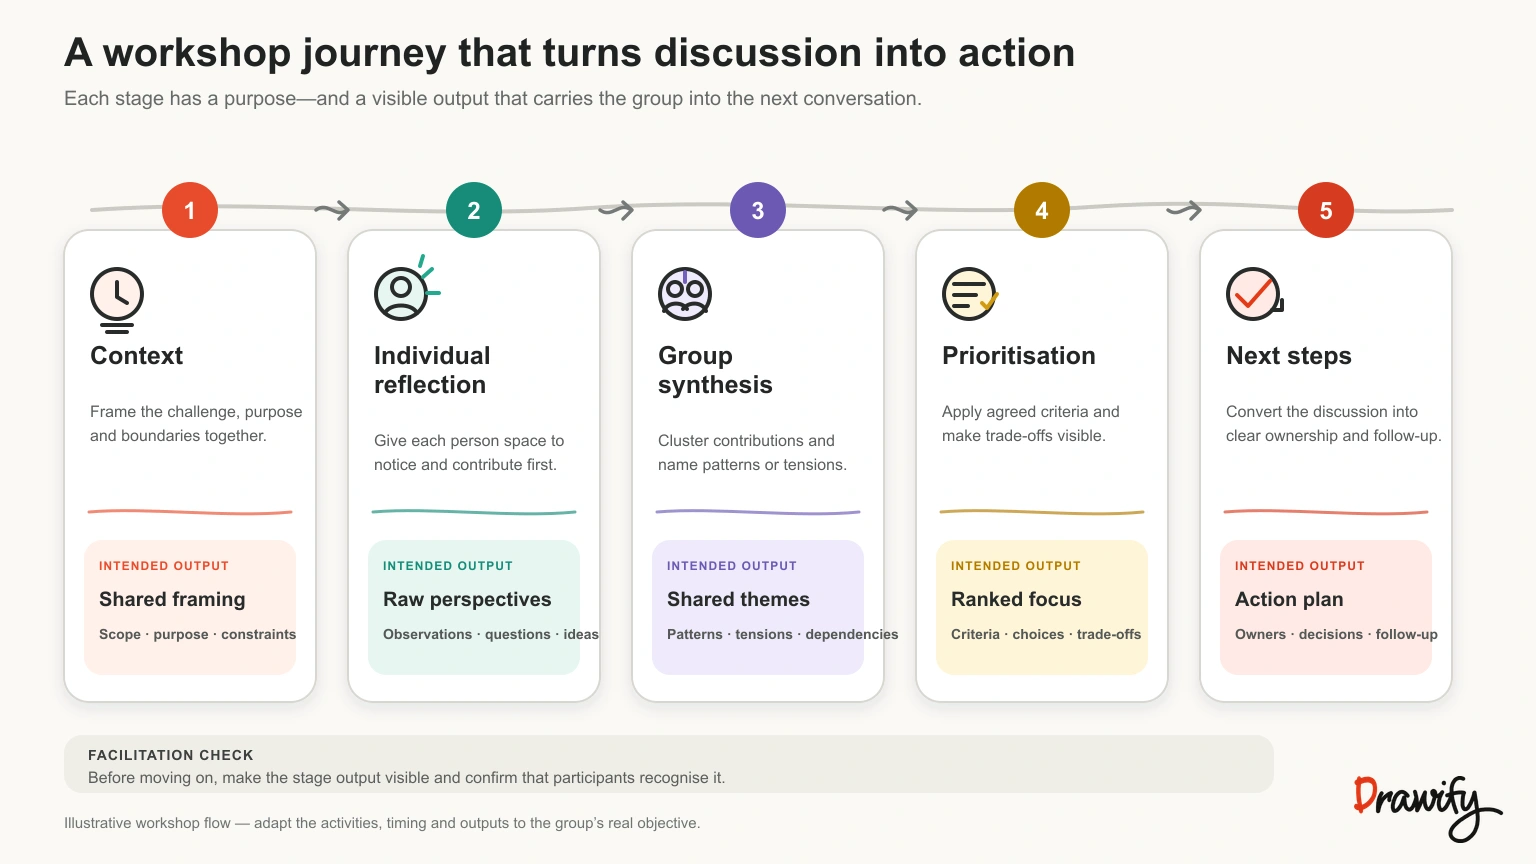
Workshop facilitation: orient participants around the task
Create an agenda visual, challenge map or future-state prompt before a session.
Use the visual as shared context while capturing participant input in the appropriate collaboration or documentation tool.
Change communication: connect the reason, transition and destination
Show why change is needed, what people will experience during the transition and what the future way of working means for different roles.
Avoid presenting the future state as guaranteed when dependencies or decisions remain open.
Proposals and pitches: explain how the engagement will work
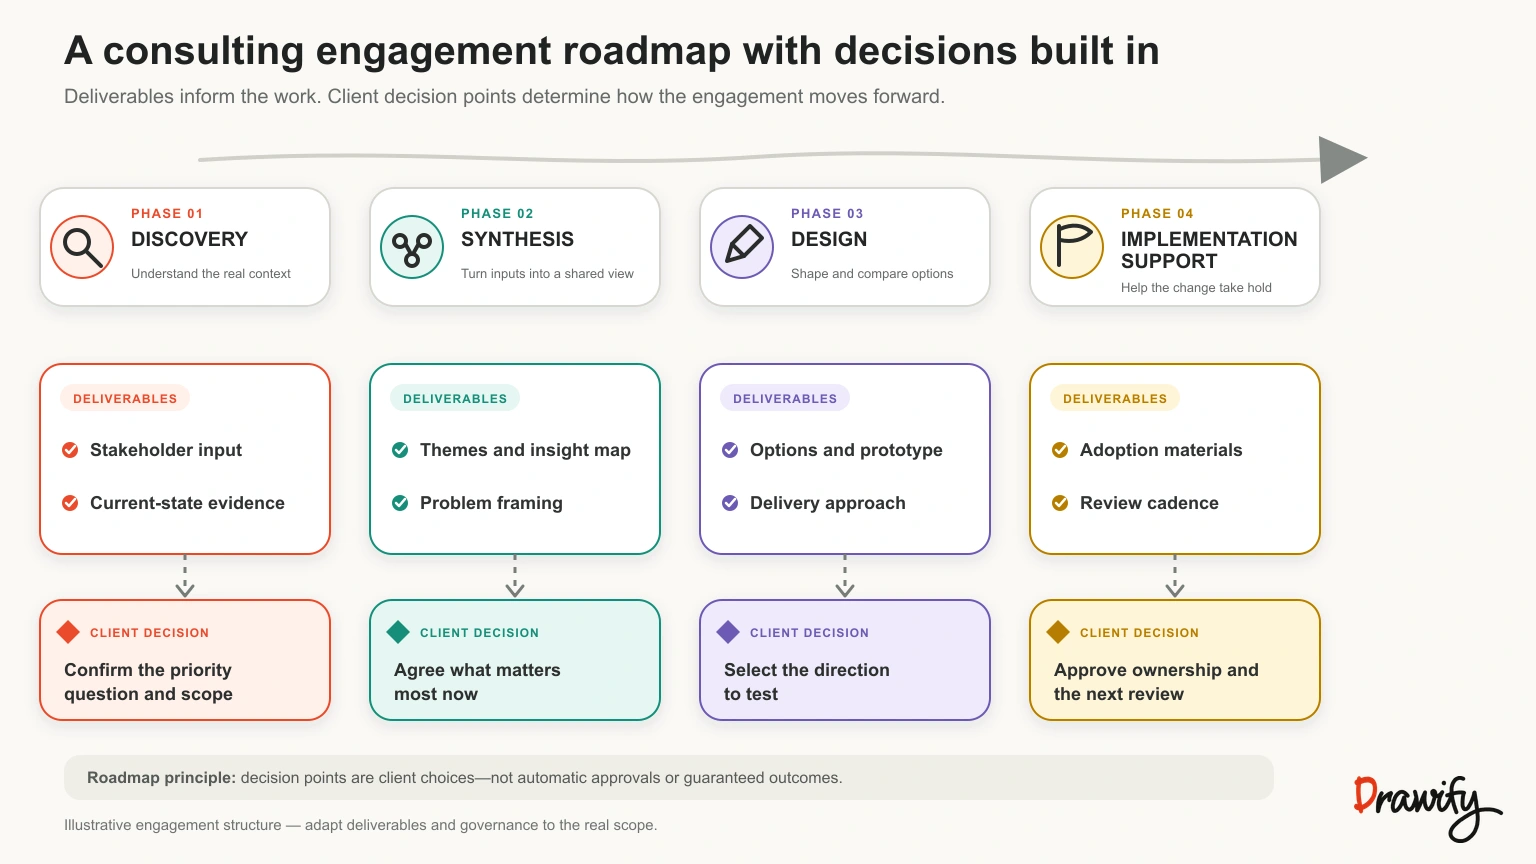
Visualise the client's challenge, your approach, phases of work and intended deliverables.
Case studies: structure the evidence of completed work
Present context, intervention and documented result as a sequence.
Only include outcomes supported by approved client evidence. Do not use an illustration to imply a quantified improvement that was not measured.
Choosing the right visual structure
| Consulting question | Useful structure | Possible Drawify starting point |
|---|---|---|
| Where are we now and where are we going? | Current state → future state | Roadmap or current/future structure |
| Who is involved? | Relationship or stakeholder map | Stakeholder-style template |
| How does the work happen? | Ordered flow with handoffs | Process-flow structure |
| What will the engagement do? | Phases, decisions and outputs | Roadmap or agenda |
| What did the research reveal? | Findings → implications → priorities | Blank canvas or research template |
These are communication structures rather than prescribed consulting methods. Use the framework appropriate to the engagement and apply it correctly.
What Drawify does — and what it does not do
Drawify helps consultants assemble business visuals from artist-created illustrations, templates, text and composition tools.
It supports creating visual projects and exporting them for use in client deliverables.
Drawify does not replace:
- client research or discovery;
- data analysis;
- a correctly applied consulting framework;
- subject-matter judgement;
- validation with stakeholders;
- decision logs or implementation plans; or
- the consultant's responsibility to handle client information appropriately.
Drawify supports communication while the consultant remains accountable for the work being communicated.
Working with confidential client information
Use only information you are authorised to place in a visual platform.
Remove personal data, confidential client details and commercially sensitive material from examples intended for public use.
For client deliverables, follow the engagement's data-handling rules and your organisation's security process.
Do not assume that a visually simplified item is no longer confidential.
When publishing a case study or portfolio example, replace client-specific information unless written approval allows its use.
Frequently asked questions
What is visual storytelling for consultants?
It is the practice of arranging analysis, evidence and recommendations into a visual sequence that helps a client follow the relationships between context, issue, response and next steps.
How can consultants use Drawify?
Consultants can use Drawify's artist-created illustrations, editable templates, text and composition tools to build strategy visuals, stakeholder maps, process stories, workshop materials, proposals and other client communication. Finished projects can be exported as PNG, JPEG or PDF.
Do I need to know how to draw?
No. Drawify provides existing hand-drawn illustrations from professional artists and templates that you can arrange and customise. You still need to make the communication and analytical decisions behind the visual.
Can I use Drawify visuals in client presentations?
Drawify supports exporting projects as PNG, JPEG and PDF for use in other software. Exact commercial-use rights depend on the current plan, asset and applicable terms, so review Drawify's current pricing and licence information before client use.
Does Drawify work with Miro and Google Slides?
Drawify has integrations for Miro and Google Slides. Each integration has its own documented workflow and should not be described as automatic synchronisation with every Drawify project.
Can Drawify analyse client data or recommend a strategy?
No. Drawify is a visual storytelling platform. It can help structure and present a consultant's work, but it does not replace data analysis, framework selection, validation or professional judgement.
Can I create a visual from scratch?
Yes. You can start from a blank canvas or adapt a template. Choose the option that best matches the story structure and the level of customisation needed.
How should I use a Drawify visual in a workshop?
Prepare the context, agenda or challenge structure in advance, then use it to orient participants. Capture workshop contributions and decisions in the appropriate collaboration or documentation tool rather than treating a prepared illustration as the workshop record.
How do I keep a consulting visual evidence-based?
Label assumptions, show the source of important facts, distinguish findings from recommendations and avoid implying causation or performance outcomes that the engagement did not establish. Review the visual with the responsible subject-matter expert or client stakeholder.
Make the next client conversation easier to follow
Build a visual that shows the context, the central issue and the next decision — using illustrations and structures designed for business storytelling.
Get visualisation tips every week
Subscribe to the Drawify Newsletter, and feed your creativity with visualisation tips and techniques, as well as the latest Drawify workshops, news and resources.