Whether you've got stories to tell or art to create, there's a place for you here.

Online Course Creators
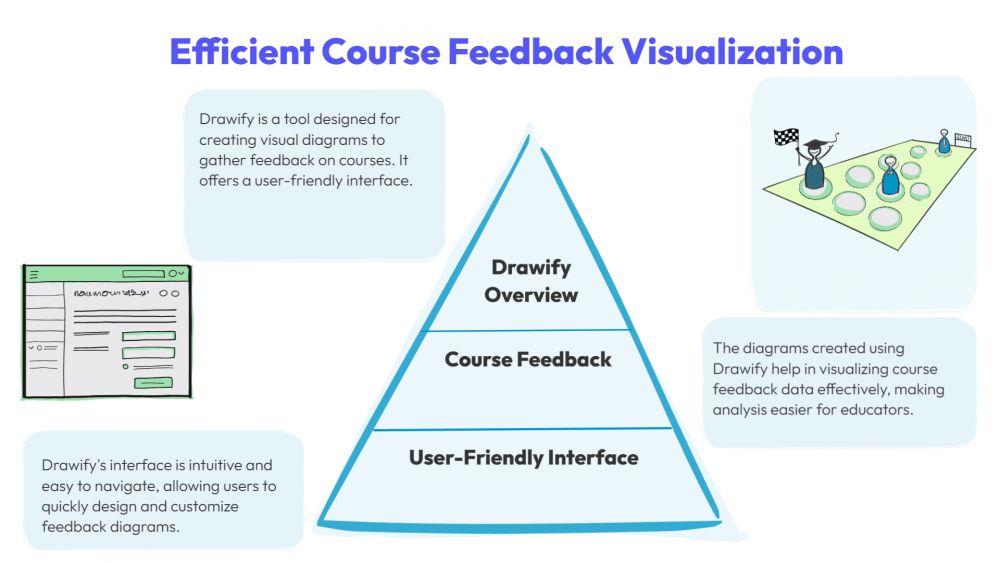
Drawify for Course Feedback Diagrams
-
SDSwarnali Das- Co-founder, Chief Product Officer, Drawify
-
Oct 06, 2025 5 min read
In the field of training and education, feedback is essential for growth. Course feedback offers important insights into how students experience the material and instruction, whether it comes from faculty assessments, peer reviews, or student evaluations. Reports with a lot of content or long survey findings, however, can frequently feel overwhelming. This is the role of Drawify for Course comments Diagrams, which turns complex comments into understandable, captivating images that encourage practical enhancements.
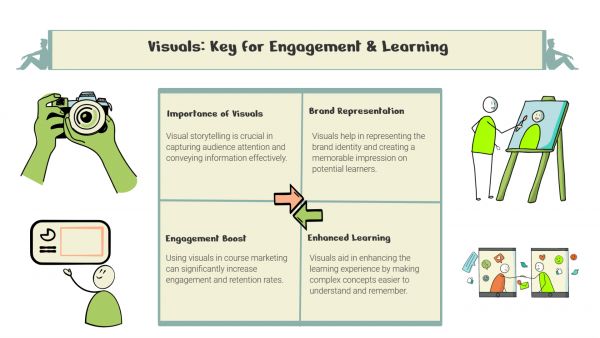
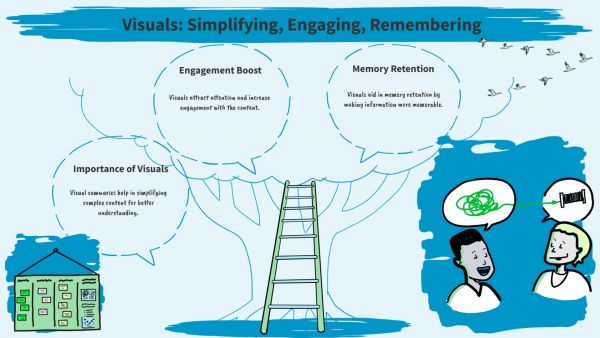
Why Visualize Course Feedback:
Traditional feedback methods, such as academic papers, spreadsheets, or written surveys, might make it challenging to quickly recognise trends. Using Drawify to create diagrams and infographics from this data, instructors and trainers can:
- Identify Trends Fast: Recognise patterns in learner performance and satisfaction.
- Emphasise Your Pros and Cons: Determine what is effective and what requires modification.
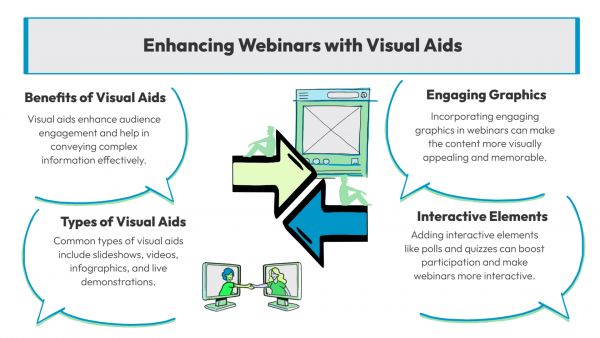
- Engage Stakeholders: Engage stakeholders by clearly and visually appealingly presenting outcomes to students, professors, or administrators.
- Motivate Action: It is simpler to transform feedback into better instruction and course design when there are visuals involved.
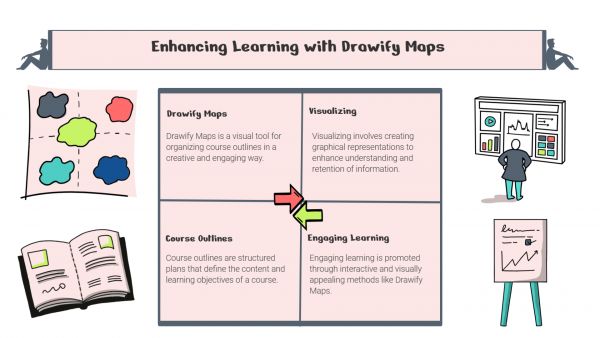
How Course Feedback Diagrams Are Improved with Drawify:
Drawify offers templates that can be edited and visuals that infuse data-driven insights with originality and clarity. This is how it's beneficial:
- Data-to-Diagram Conversion:
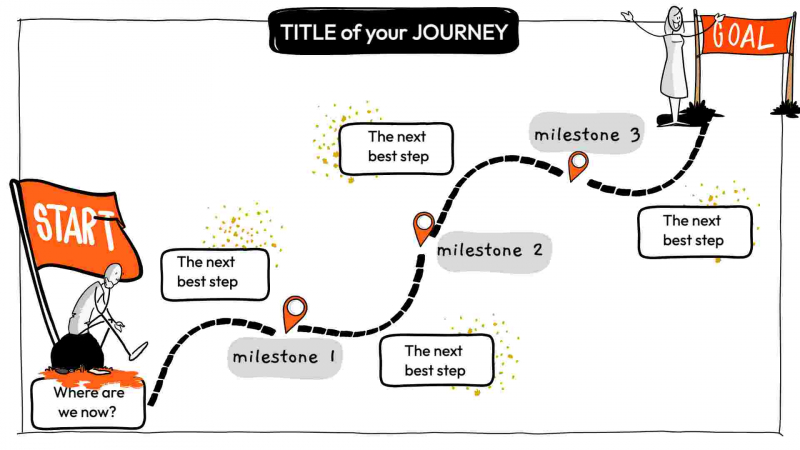
Survey percentages or feedback scores can be converted into flow diagrams, pie charts, or bar graphs. These diagrams are not only educational but also aesthetically pleasing with the help of Drawify's visual library. - Student Journey Maps:
Observe the student's journey from the start of the course to its conclusion. Key touchpoints where feedback can direct improvements are highlighted by illuminating the route. - Strength vs. Weakness Visuals:
Heatmaps, dashboards, and contrast visualisations can be used to show regions that are doing well and those that need improvement. - Open-Ended Feedback Visualizations:
Teachers might summarise important topics using word clouds, icon-based infographics, or categorised visualisations rather than drowning qualitative replies in text.
Comparative Feedback Over Time
Use timelines, trend diagrams, and comparative images to highlight progress over several training sessions or semesters.
Benefits for Educators and Institutions:
- Better Communication: Visual presentations of comments facilitate faculty meetings and accreditation assessments.
- Increased Involvement: When feedback is converted into meaningful graphics, participants feel their opinions count.
- Faster Decision-Making: Long reports can be interpreted more quickly when there are clear diagrams.
- Professional Presentation: When presenting findings to stakeholders or outside assessors, visuals increase credibility.
Practical Use Cases of Drawify in Course Feedback:
- Colleges and Universities: Make faculty growth easier by streamlining semester-end student assessments.
- Corporate Training: Provide leadership with learner satisfaction data in an understandable, expert manner.
- Online Learning Platforms: Visually illustrate platform enhancements and map the user experience.
- Workshops and Bootcamps: Provide prompt, interesting diagrams that convey post-event feedback.
To conclude, feedback is only as good as the action it motivates. Drawify for Course input Diagrams helps organisations and educators bridge the gap between unfiltered feedback and significant enhancements. Feedback is easier to understand when ideas are visualized, and it also promotes group problem-solving and creative course design.
With Drawify, user feedback becomes a growth roadmap rather than merely being in reports.
Post This Article to Your Socials
Popular Topics
- Events
- Workshops
- Visual Storytelling
- How to video
- Communities
- Sketchnoting
- Templates
- UX Designers
- Agile Professionals
- Product Managers
- Freelance Graphic Designers
- Creative Tech Enthusiasts
- Online Course Creators
- Social Media Content Creator
- Creative Agency Owners
- Marketing Professionals
- EdTech Professionals
- Scrum Masters
Similar Articles
Come, Be Part of Something Special
-
Got ideas that need visual superpowers?
Jump in and start creating presentations and communications that people actually remember.
Sign In -
Are you an artist ready to grow?
Join our Drawifier family and focus on what you love most - creating art that matters.
Become a Drawifier
Get visualisation tips every week
Subscribe to the Drawify Newsletter, and feed your creativity with visualisation tips and techniques, as well as the latest Drawify workshops, news and resources.
