Whether you've got stories to tell or art to create, there's a place for you here.

UX Designers
Transforming User Feedback into Visual Diagrams
-
SDSwarnali Das- Co-founder, Chief Product Officer, Drawify
-
Sep 23, 2025 5 min read
Understanding users is an essential requirement for businesses in the fast-paced digital world of today. Whether developing a SaaS platform, managing client interactions, or creating a mobile app, user feedback is essential for directing improvements. However, raw input from surveys, interviews, or support requests can frequently prove challenging as well as difficult for one to comprehend.
Here's when visual diagrams are useful. Teams can more easily find patterns, pinpoint issues, and reach well-informed conclusions when user feedback is transformed into visual representations. Organisations may better align teams, improve communication, and execute changeable improvements by turning intricate feedback into structured diagrams.
Here, in this article, we will discuss the importance of visual diagrams for feedback analysis, several methods for transforming input, and recommended practices to make sure your visuals effectively achieve results.
Why It's Important to Visualise User Feedback:
When properly analysed, user feedback can yield a wealth of insights. Here's why creating diagrams from feedback is so effective:
- Simplifies Complexity: Feedback is often provided in a number of forms, including chat logs, open-ended text comments, survey ratings, and usability testing notes. Visual diagrams simplify this intricacy into structures that are simple to understand.
- Reveals Hidden Patterns: When feedback is visually represented, it draws attention to recurrent themes and problems that may not be apparent when reading it line by line.
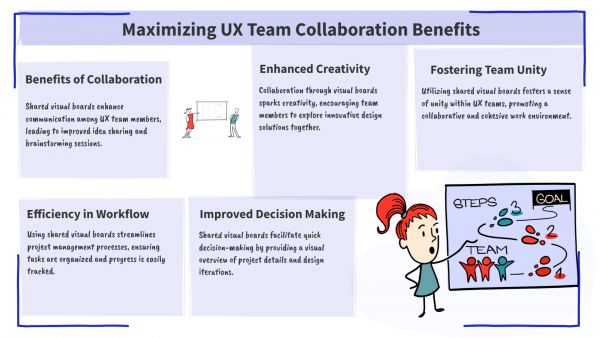
- Enhances Collaborative Teamwork: Not every team member has the time to go through hundreds of responses to surveys. Having a common visual language, diagrams keep designers, developers, marketers, and product managers in alignment.
- Promotes Quicker Decision-Making: Rather than arguing over abstract facts, teams can swiftly prioritise changes when feedback is visually mapped.

Types of Visual Diagrams for User Feedback:
The functions of various diagrams differ. The following visualisations can be used separately or in combination, depending on what you want to accomplish:
- Affinity Diagrams: Feedback is categorised or grouped into themes using affinity diagrams. For instance, complaints regarding "slow loading time" and "app freezing" may be grouped together under the performance issue category. Teams can use this to pinpoint key areas of concern.
- Journey Maps: Maps of customer journeys show feedback at several points in the user journey, such as discovery, purchase, and retention. Teams can identify where user experiences differ by mapping pain points at each step.
- Heatmaps: Heatmaps display the locations of user clicks, scrolls, and drops for usability testing and product feedback. They graphically display which features consumers find most annoying and which sections receive the greatest interaction.
- Flowcharts: Flowcharts show how users go through processes. When input is added, they illustrate workflow difficulties and points of misunderstanding.
- Fishbone (cause-and-effect) Diagrams: These diagrams assist teams in determining the underlying reasons of persistent problems that consumers have experienced. The fishbone diagram, for instance, can identify reasons such as device compatibility, server overload, or coding issues if customers report frequent app breakdowns.
- Word Clouds: Word clouds, a less complex visualisation, show the terms that are most commonly used in open-text feedback. Despite being less structured, they give users a quick overview of their top concerns.
Steps to Transform User Feedback into Visual Diagrams:
Let us look at the procedure in detail:
Step 1: Collect Feedback from Multiple Sources: Feedback can come from:
- Customer Support Tickets
- App Store Reviews
- Social Media Mentions
- User Surveys
- Beta Testing Reports
- Focus Group Discussions
Before beginning visualisation, be sure that you collect all of the input into a single location.
Step 2: Clean and Organise the Data: Feedback can be messy. Prior to visualisation, classify responses, eliminate duplicates, and filter out irrelevant information. Feedback platforms, Google Sheets, and Excel are examples of tools that can assist in organising the data.
Step 3: Identify Key Themes: Assemble responses that are similar. For example, group people under usability concerns in the checkout flow if they frequently comment "confusing checkout".
Step 4: Choose the Right Diagram Type:
- To determine categories, utilise affinity graphs.
- Utilise journey maps to identify pain spots unique to each stage.
- Utilise heatmaps to gain insights into usability.
- Fishbone diagrams can be used to examine causes.
The nature of input and the purpose of the analysis will determine which option is ideal.
Step 5: Create the Diagram:
- For journey maps and affinity diagrams, use MURAL or Miro.
- Figma for prototypes and flowcharts
- Crazy Egg or Hotjar for heatmaps
- For fishbone diagrams, Lucidchart
Step 6: Share and Iterate: Diagrams are expected to be shared with stakeholders after they are developed. To ensure that the diagrams effectively depict the insights, obtain input from your internal team and make any adjustments.
Tools for Creating Visual Diagrams from Feedback:
The following are some of the best resources for converting input into images:
- Miro – Excellent for collaborative brainstorming and affinity mapping.
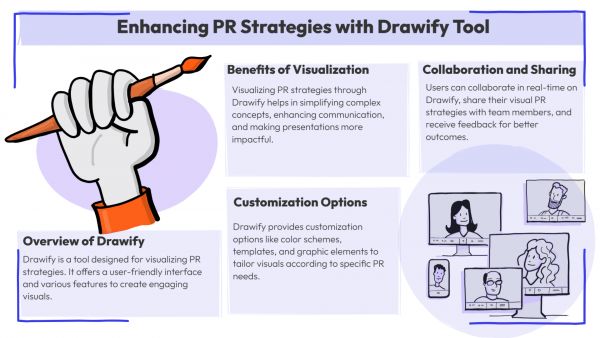
- Drawify – Ideal for quick illustrations that add storytelling to diagrams.
- Figma – Popular among design teams for mapping user flows and creating journey maps.
- Dovetail – Specialises in analysing qualitative feedback and linking it to visual insights.
- Hotjar – Provides heatmaps and session recordings based on user behaviours.
The Best Methods for Visualising Feedback Effectively:
It is insufficient to merely draw diagrams. Make sure your images provide genuine value by adhering to these recommended practices:
- Keep Things Easy: Diagrams that are too complex may confuse stakeholders. Prioritise clarity over specifics.
- Make Use of Consistent Categories: When arranging feedback into groups, comply with standard naming rules. Always refer to performance difficulties as "performance", for instance, rather than combining phrases like "speed" or "lag".
- Make High-Impact Issues a Priority: Not every piece of feedback is equally significant. Emphasise the problems that have the greatest effect on customer happiness and corporate objectives.
- Update Frequently: Feedback from users is continual. To account for emerging trends and persistent problems, update your diagrams on a regular basis.
- Integrate visual storytelling: To make diagrams more interesting and simpler to understand quickly, include icons, pictures, or colour codes.
Real-World Example: Transforming Feedback into Action:
Assume that a SaaS provider gets hundreds of support tickets per month. They find repeated grievances after classifying the feedback:
- Having trouble logging in
- Uncertainty over pricing schemes
- Dashboard performance is sluggish.
They pinpoint three main issues—access problems, unclear pricing, and performance issues—by turning this feedback into an affinity diagram. After mapping these issues on a customer journey map, they discover that login annoyances occur throughout the onboarding phase. Since resolving login flows immediately increases user retention, this insight aids them in prioritising improving them first.
Benefits of Visualising User Feedback:
When feedback is regularly transformed into diagrams, organisations benefit from:
- Clarity: Turn unstructured input into organised understandings.
- Collaboration: Make it simple for cross-functional teams to coordinate.
- Efficiency: Avoid manual data assessments to save time.
- Actionability: Emphasise priorities and next actions.
- Continuous Improvement: Continue to enhance user experiences in response to changing input.
Thus, to conclude, in the era of digitalisation, companies cannot afford to disregard customer feedback. But raw feedback is frequently too dispersed and complicated to take action on. Organisations can streamline analysis, reveal hidden patterns, and bring their teams together around actionable insights by turning user feedback into visual diagrams. The appropriate design can serve as a link between user frustration and product enhancement, whether you're using affinity diagrams to group replies, journey maps to monitor pain points, or heatmaps to show engagement. Visual feedback analysis is not a luxury; it is essential to businesses that seek to develop creatively quickly while keeping customers at the centre of every choice.
Post This Article to Your Socials
Popular Topics
- Events
- Workshops
- Visual Storytelling
- How to video
- Communities
- Sketchnoting
- Templates
- UX Designers
- Agile Professionals
- Product Managers
- Freelance Graphic Designers
- Creative Tech Enthusiasts
- Online Course Creators
- Social Media Content Creator
- Creative Agency Owners
- Marketing Professionals
- EdTech Professionals
- Scrum Masters
Similar Articles
UX Designers
SD
Swarnali Das
5 min read
UX Designers
SD
Swarnali Das
5 min read
Come, Be Part of Something Special
-
Got ideas that need visual superpowers?
Jump in and start creating presentations and communications that people actually remember.
Sign In -
Are you an artist ready to grow?
Join our Drawifier family and focus on what you love most - creating art that matters.
Become a Drawifier
Get visualisation tips every week
Subscribe to the Drawify Newsletter, and feed your creativity with visualisation tips and techniques, as well as the latest Drawify workshops, news and resources.
