Whether you've got stories to tell or art to create, there's a place for you here.

Freelance Graphic Designers
Illustrating Trend Reports for Freelancers
-
SDSwarnali Das- Co-founder, Chief Product Officer, Drawify
-
Dec 14, 2025 5 min read
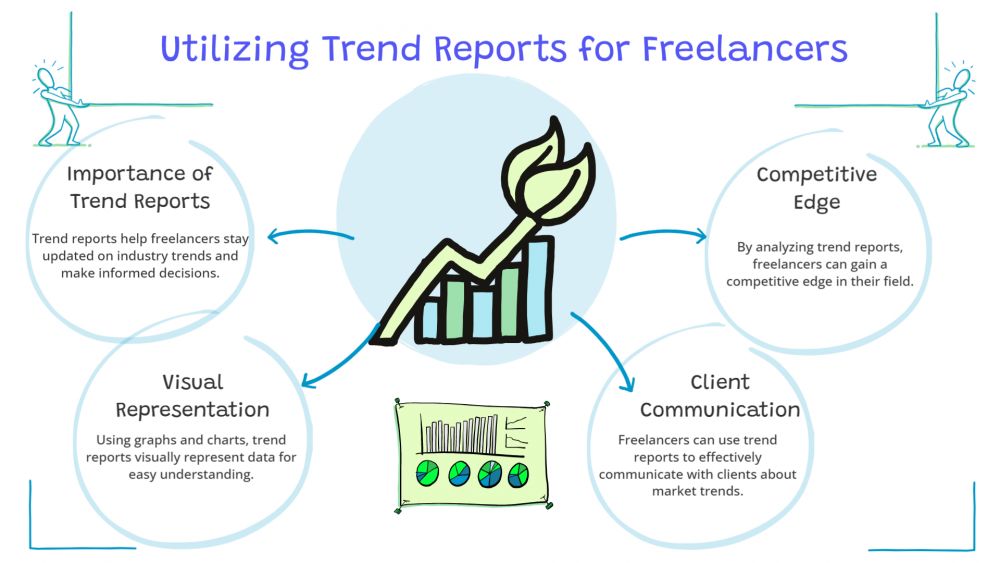
Okay, real talk: if you're freelancing in any creative or strategic field, trend reports are basically your secret weapon. They prove you know your stuff, they attract better clients, and honestly? They're a great excuse to charge more.
But here's where most freelancers mess up.
They write these massive, text-heavy documents that nobody - and I mean nobody - actually reads all the way through.
Your clients are busy. They want the insights without having to decode a novel. They want visuals. They want something they can flip through during their morning coffee and still feel informed.

Enter Drawify.
Why You Should Care About Making Things Visual:
Quick question: when's the last time you sat down and read a 15-page report cover to cover? Exactly.
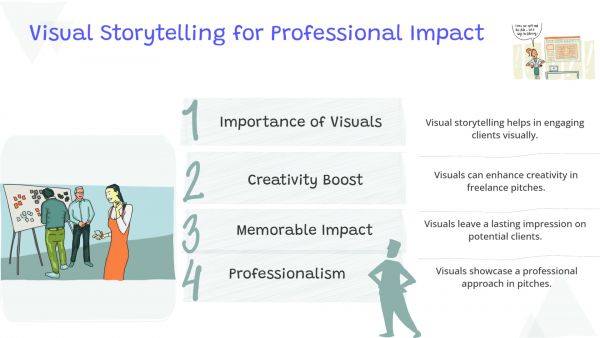
Here's what visuals actually do for you:
They make complicated things simple: A good icon or illustration can explain in two seconds what takes you a paragraph to write.
They make you look like you have your life together: Clean visuals signal professionalism. A wall of text in Times New Roman? Not so much.
They separate you from the pack: Most freelancers are still out here sending Word docs. Be the person who sends something people actually want to open.
They travel further: People share visual content. They screenshot it. They send it to their teams. Text just sits there.
Why Drawify Gets It:
Look, Drawify isn't here to make you learn Illustrator or spend hours on Canva. It's for people who need solid visuals without the headache.
Real illustrations, not stock photo garbage: These are hand-drawn by actual artists. You know that authentic, human touch? Yeah, that.
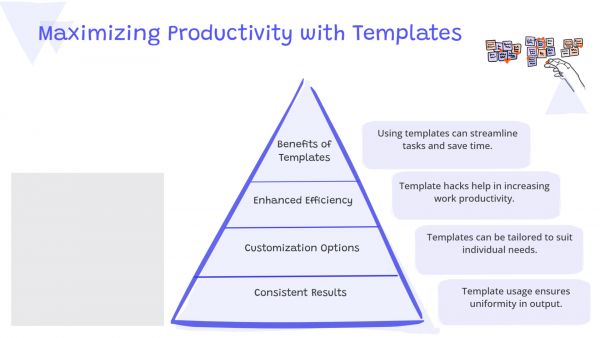
Templates that have your back: Market shifts, timelines, comparisons — there's already a template waiting. Just drop in your content and get on with your day.
AI does the hunting for you: Stop scrolling through endless image libraries. The AI suggests what fits your content. It's weirdly helpful.
Easy enough for anyone: If you can drag and drop, you can use Drawify. No design skills required.
Use it literally everywhere: Client deck? Check. PDF report? Yep. Social media posts? Sure. Email newsletter? Why not?
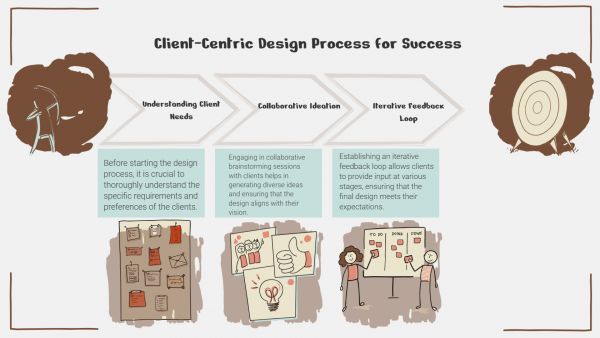
How to Actually Put Drawify to Work:
- Try Visual Metaphors (Seriously, They Work)
- Don't write "Remote work is on the rise." Show a laptop with a rocket attached to it. Or a home office with growth arrows everywhere.
- I know it sounds a bit extra, but visual metaphors are insanely effective. Your brain processes visuals way faster than text.
Create a One-Pager That Really Lands:
- Take your best insights — the stats, the big ideas, the key takeaways — and combine them into one killer infographic page.
- This is the page people will save. The one they'll send to their boss. The one that makes them think "damn, this freelancer knows what they're doing."
Make Data Look Good (For Once):
- Let's be honest, numbers in paragraph form are the worst. But put those same numbers in a clean chart or diagram? Suddenly, everyone cares!
- Growth trends, market cycles, user behaviour — whatever you're tracking, visualizing it makes it feel more real and more important.
Show How Things Evolved:
- Trends have a story. They started somewhere, changed over time, and they're headed somewhere else.
- Map that out on a timeline. Where did this trend begin? What were the turning points? Where are we now? Where's it going?
This kind of context is especially valuable if you're consulting or doing any kind of strategic work.
Put Faces on the Data:
- Not everything is about charts and graphs. Sometimes you're talking about actual people — customers, users, different audience types.
- Use persona illustrations to represent them. It makes your insights feel less like abstract theory and more like something that applies to real human beings.
Quick Tips So You Don't Screw It Up:
Keep your style consistent: Don't use cartoons on page 1 and minimalist line art on page 3. Pick a lane.
Don't overcrowd your pages: White space isn't wasted space. Let things breathe.
Replace words with visuals whenever you can: If a diagram tells the story better than three paragraphs, use the diagram.
Make the important stuff pop: Throw an icon next to your biggest stat. Add a badge to your key finding. Make it impossible to miss.
Export quality stuff: Pixelated images make you look amateur. Drawify handles high-res exports, so use them.
What's In It for You:
You can charge more: Visual work looks more valuable because it is more valuable. Price accordingly.
You'll finish projects faster: No more staring at a blank page trying to figure out how to make your report interesting. Grab a template and go.
Fewer confusing client conversations: When your insights are visual, there's less "wait, what did you mean by that?" Everyone gets it.
Your reputation improves: Keep delivering polished, visual work, and people start seeing you as the go-to person. That's how you stop chasing clients and start having them come to you.
Here's The Deal:
Trend reports should be one of your best marketing tools. But only if people actually engage with them.
Drawify helps you turn your insights into something people want to read, save, and share. Whether you're analysing consumer behaviours, tracking industry changes, or just trying to prove you're ahead of the curve, having the right visuals makes everything click.
So, stop sending reports that feel like homework. Start sending the kind that makes clients think "I need to work with this person."!!
Post This Article to Your Socials
Popular Topics
- Events
- Workshops
- Visual Storytelling
- How to video
- Communities
- Sketchnoting
- Templates
- UX Designers
- Agile Professionals
- Product Managers
- Freelance Graphic Designers
- Creative Tech Enthusiasts
- Online Course Creators
- Social Media Content Creator
- Creative Agency Owners
- Marketing Professionals
- EdTech Professionals
- Scrum Masters
Similar Articles
Come, Be Part of Something Special
-
Got ideas that need visual superpowers?
Jump in and start creating presentations and communications that people actually remember.
Sign In -
Are you an artist ready to grow?
Join our Drawifier family and focus on what you love most - creating art that matters.
Become a Drawifier
Get visualisation tips every week
Subscribe to the Drawify Newsletter, and feed your creativity with visualisation tips and techniques, as well as the latest Drawify workshops, news and resources.
