Whether you've got stories to tell or art to create, there's a place for you here.

Product Managers
Enhancing Reports with Product Visuals
-
SDSwarnali Das- Co-founder, Chief Product Officer, Drawify
-
Oct 03, 2025 5 min read
Reports today are about making an impression, not just about numbers and text. Visuals are essential for conveying clear, engaging messages across sales updates, performance reviews, and product analyses. Drawify transforms information into presentations that express insights and attract attention with its library of customisable graphics.

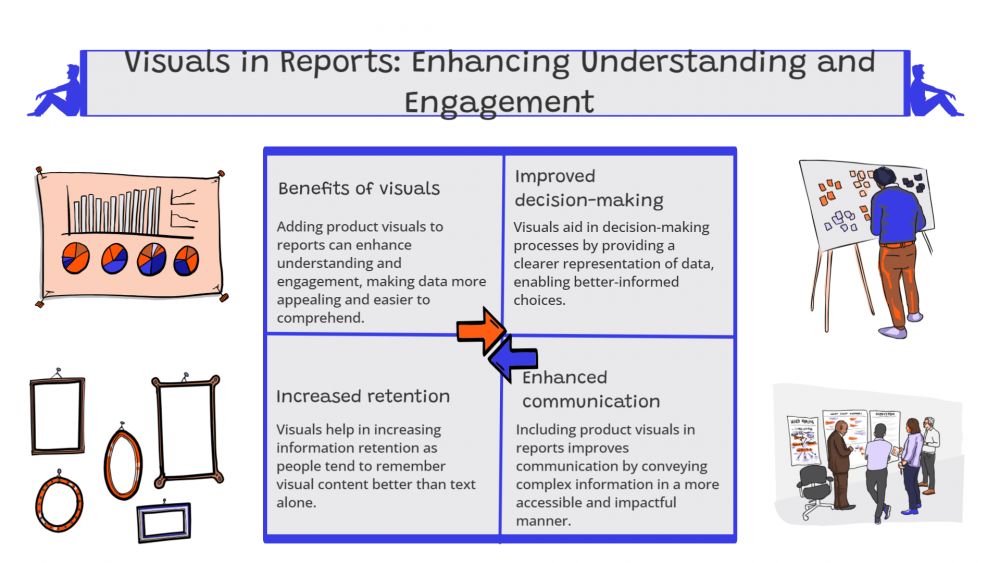
The Significance of Product Images in Reports:
Product images add inventiveness, context, and clarity to reports. Visual tools help readers understand information quickly. Here are some key benefits: Better Understanding: Images make difficult concepts easier to understand.
- Increased Engagement: Captivating images grab readers' attention.
- Professional Appeal: Stakeholders are left with a lasting impression by well-designed reports.
- Faster Decision-Making: Teams can analyse data more effectively when they use visual summaries.
You may transform static reports into dynamic communication tools by using illustrations.
How Drawify Transforms Report Design:
With Drawify, adding visually appealing reports that appeal to your audience has become simpler than ever. Here's how:
- Custom Product Illustrations: Present your products in unique styles that are in tune with your brand.
- Ready-to-Use Visuals: To quickly illustrate concepts, procedures, or comparisons, access an extensive library of customisable graphics.
- Storytelling Power: Create story-based reports that motivate action by fusing data and images.
- Collaboration-Friendly: Teams can work together to jointly develop and improve drawings, guaranteeing uniformity throughout reports.
- Easy Integration: Easily export images and include them in digital reports, presentations, or PDFs.
Practical Applications of Product Visuals in Reports:
- Sales Reports: Use product-specific images to highlight sales growth and top-performing products.
- Marketing Reports: Use visually appealing illustrations to show campaign outcomes and customer interaction.
- Financial Reports: To separate revenue sources by product line, use icons and graphics.
- Product Development Reports: Effectively illustrate feature comparisons or stages of the product lifecycle.
Why Use Drawify to Improve Reports:
Drawify graphics, in lieu of generic stock photos, are versatile, customisable, and designed for narrative applications. They can be modified to fit the tone of your business, making your reports convincing and visually consistent in addition to being educational.
Improving reports with product images is now an essential requirement for present-day business communication; it is no longer an option. Simple reports may be transformed into powerful, inspiring papers that encourage stakeholders and aid in decision-making with Drawify.
Adding images and data together will take your reporting process to the next level.
Post This Article to Your Socials
Popular Topics
- Events
- Workshops
- Visual Storytelling
- How to video
- Communities
- Sketchnoting
- Templates
- UX Designers
- Agile Professionals
- Product Managers
- Freelance Graphic Designers
- Creative Tech Enthusiasts
- Online Course Creators
- Social Media Content Creator
- Creative Agency Owners
- Marketing Professionals
- EdTech Professionals
- Scrum Masters
Similar Articles
Come, Be Part of Something Special
-
Got ideas that need visual superpowers?
Jump in and start creating presentations and communications that people actually remember.
Sign In -
Are you an artist ready to grow?
Join our Drawifier family and focus on what you love most - creating art that matters.
Become a Drawifier
Get visualisation tips every week
Subscribe to the Drawify Newsletter, and feed your creativity with visualisation tips and techniques, as well as the latest Drawify workshops, news and resources.
