Whether you've got stories to tell or art to create, there's a place for you here.

Creative Agency Owners
Visualizing Profit Margins Creatively
-
ARAnshu Raj- Founder & CEO, Drawify
-
Oct 03, 2025 5 min read
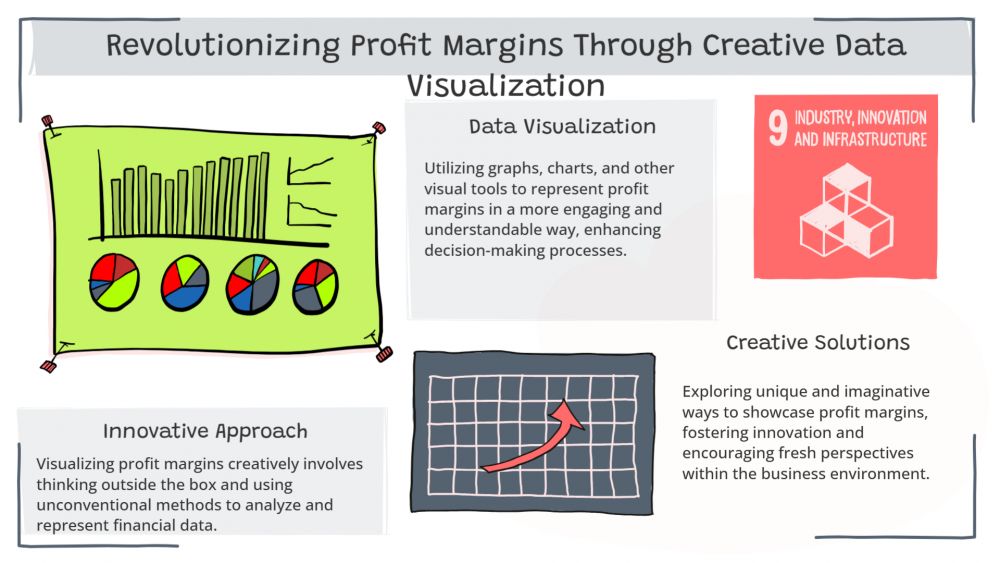
Numbers alone are no longer sufficient to promote clarity and informed decision-making in today’s competitive business environment. Although profit margins are one of the most important indicators for any company, stakeholders may become disinterested or overwhelmed by the endless rows of spreadsheets and charts. Financial data can be transformed into visually appealing images that are easy to understand, discuss, and act upon with the help of a creative visualization tool, such as Drawify.
Why Visualize Profit Margins:
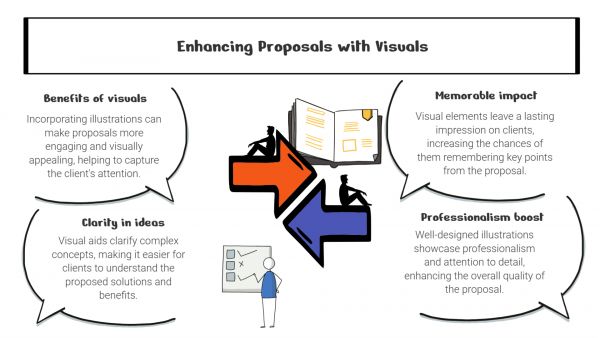
Profit margins show how well a company is doing and how efficient it is. But presenting them in the traditional way often leaves out significant information. Illustrations can:
- Simplify complex data by turning percentages and ratios into clear, easy-to-grasp images.
- Highlight patterns and trends that might be missed in raw data.
- Engage stakeholders with illustrations that are memorable and persuasive.
- Support decision-making by offering a clearer understanding of profitability across products, services, or departments.

How Drawify Transforms Profit Margin Reporting:
Drawify is an effective platform for making unique illustrations that give financial presentations lively. By creating visuals that are specific to their brand and message, firms can avoid depending entirely on generic charts or templates. Here is how:
1. Personalised Financial Metrics Icons:
Drawify allows you to depict revenue, expenses, and profit margins using customised icons and illustrations. For example, simple numbers are not as good at illustrating complex relationships as coins, growth arrows, or balance scales.
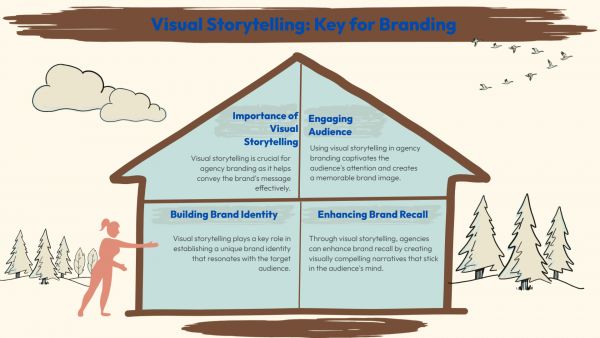
2. Using Visual Narratives to Tell Stories:
When presented as an integral component of a visual narrative, data gains additional relevance. With Drawify, companies can create stories like "the journey from losses to profitability" or "how costs decreased while margins grew."
3. Creative Dashboards:
Drawify empowers you to create visual dashboards with margins expressed through appealing infographics instead of traditional bar or pie charts, which enhances the interactivity and readability of reports.
4. Brand-Aligned Presentations:
Customisable visuals allow businesses to match them to their brand’s colours, style, and tone, maintaining uniformity in reports, presentations, and marketing brochures.
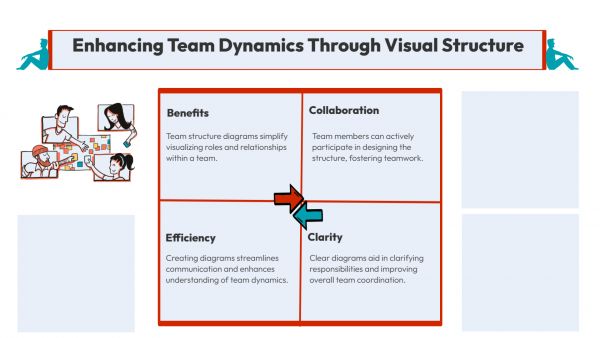
Benefits of Creative Visualization for Businesses:
- Clarity: Stakeholders understand financial performance more effectively.
- Engagement: During presentations, meetings, or reports, illustrations attract the audience.
- Retention: Visual information has a higher recall rate than numerical data.
- Take Action: Teams can make data-driven decisions more quickly when they have clear insights.
Practical Applications:
- Investor Presentations: Profit margins should be readily accessible in investor presentations using Drawify graphics.
- Internal Reporting: Motivate teams with engaging presentations of profitability growth.
- Marketing & Sales: Use imaginative profit visualisations to convey value offers.
Understanding profit margins has become significant for evaluating corporate success, but how they are presented can have a major effect. Drawify gives companies an opportunity to transform financial data into visually appealing graphics which ensure that insights are not only noticed but also easily understood, retained, and taken into consideration.
Drawify will help you illustrate profit margins in a creative way and make your financial storytelling simpler to understand if your spreadsheets aren’t engaging any customers.
Post This Article to Your Socials
Popular Topics
- Events
- Workshops
- Visual Storytelling
- How to video
- Communities
- Sketchnoting
- Templates
- UX Designers
- Agile Professionals
- Product Managers
- Freelance Graphic Designers
- Creative Tech Enthusiasts
- Online Course Creators
- Social Media Content Creator
- Creative Agency Owners
- Marketing Professionals
- EdTech Professionals
- Scrum Masters
Similar Articles
Come, Be Part of Something Special
-
Got ideas that need visual superpowers?
Jump in and start creating presentations and communications that people actually remember.
Sign In -
Are you an artist ready to grow?
Join our Drawifier family and focus on what you love most - creating art that matters.
Become a Drawifier
Get visualisation tips every week
Subscribe to the Drawify Newsletter, and feed your creativity with visualisation tips and techniques, as well as the latest Drawify workshops, news and resources.
