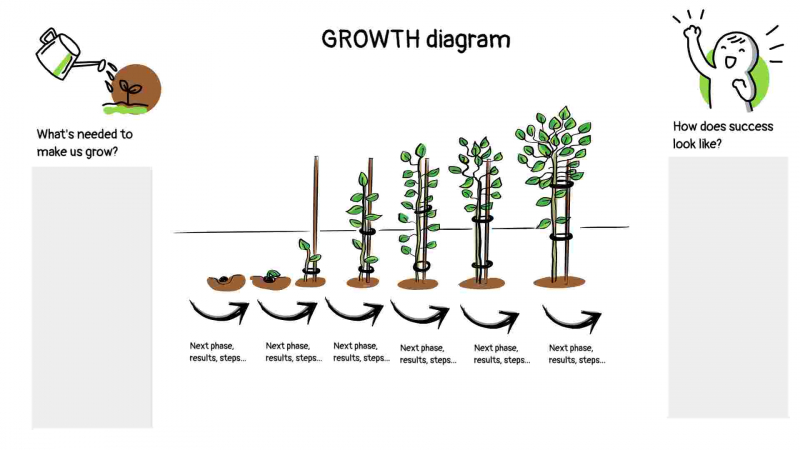
Template
Growth Diagram

Use this template as a visual way to help you define a specific growth target, as well as the specific steps to achieve that growth.
Tags in this template growth grow progress evolution evolve next steps success strategy action plan
How to use this template
The Growth Diagram template is a great way to help you and your team visualize and track the growth of a product, service, feature, or business over time.
To use this template, start on the right side: what does success look like? What's the metric you would be tracking over time, and what amount of that metric would indicate success? This could be measurable figures like revenue, number of employees, number of users, or number of subscriptions (but choose one; maximum two!).
Then, use the 'plants' in the template as a guide to show how the level of that metric could grow over time, and what activities are needed to promote that growth.
Outcomes
- Improved clarity on personal and professional growth goals
- Greater alignment between individual and team goals
- Clearer communication on progress and development needs
- Better tracking and measurement of progress over time
- Increased motivation and engagement in growth and development efforts
PRO TIP
Don't forget to play with the metaphor: what 'fertilizer' could you add, to help growth? What might need pruning along the way?
Customize the layout, content, and colors of this template, or swap elements for others to match your purpose.
Get visualisation tips every week
Subscribe to the Drawify Newsletter, and feed your creativity with visualisation tips and techniques, as well as the latest Drawify workshops, news and resources.
